Background
The mandate for the Human-Machine Interfaces (HMI) Dashboard squad at MathWorks is to give users a tool to create photorealistic dashboards within their models, enhancing visual clarity and functionality of the model.
Customer Pain
Users struggled with the lack of an integrated solution for inserting, styling, and refactoring dashboard components directly in their modeling environment. They needed an intuitive way to visualize and manage data streams.
Proposal
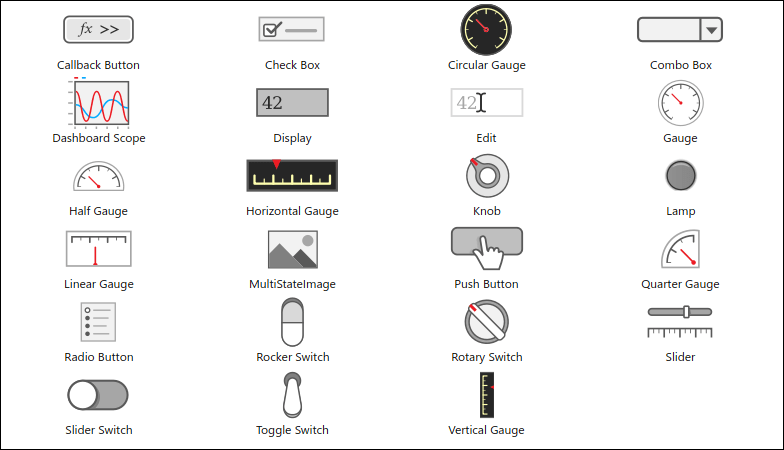
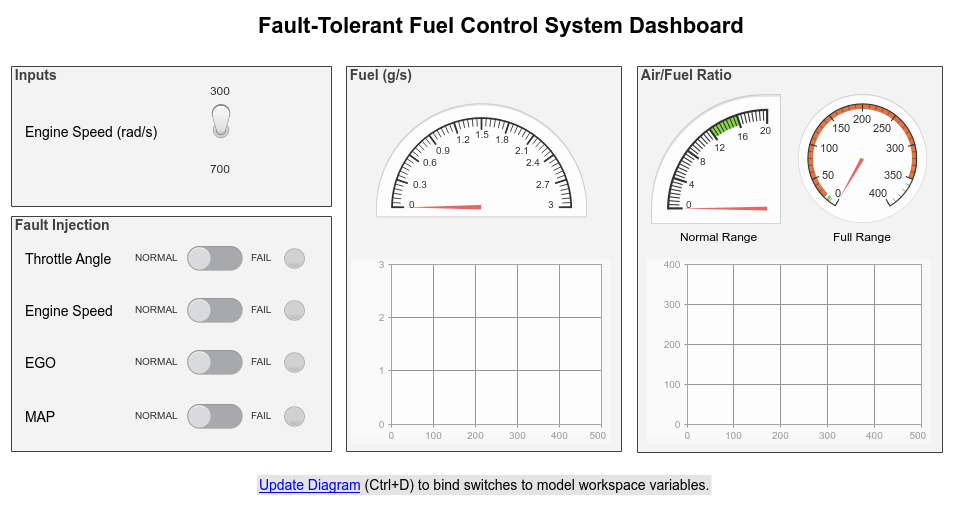
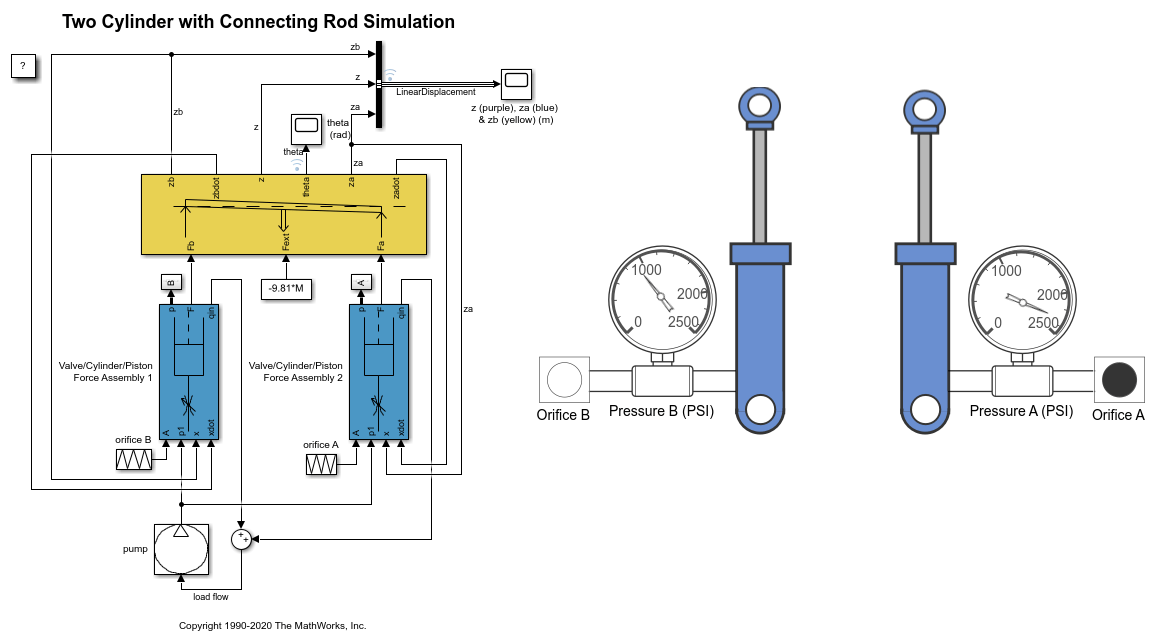
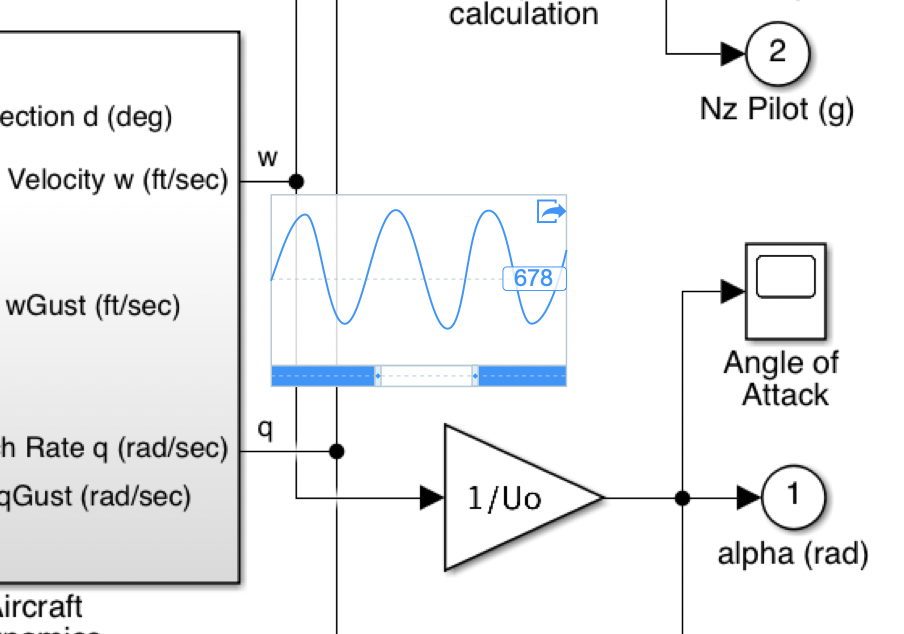
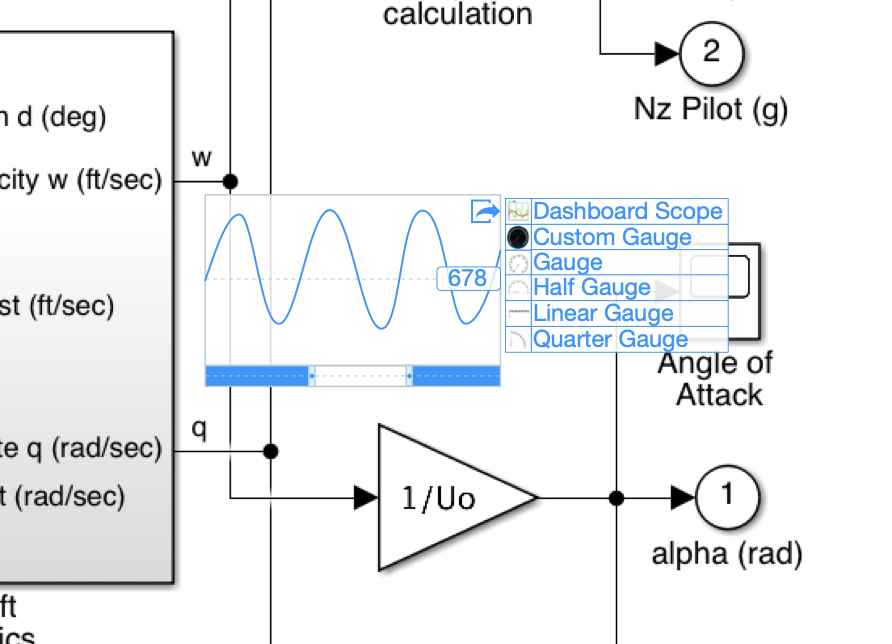
The proposed solution integrates a visual editor into the Simulink IDE, allowing users to insert components from a library, customize their appearance, and export designs for standalone displays or mobile devices. This tool supports workflows by enabling quick data stream activation and visualization, fostering seamless integration into user tasks.


